Knowing how online shoppers find your dealer website is an important KPI to understand. When properly reviewed, it can help you make more educated decisions on digital marketing spend and where to focus more of your dealership resources.
Below are few reasons why referral reports are such an important KPI for your dealership’s digital marketing, then I’ll show real examples of where to find this referral data and how to analyze it.
Why is Referral Traffic So Important?
- Identify good and bad referrers. Good = Quality = Reputable, related websites. Bad = Non-Relevant Sites = Devalues your website presence.
- Huge boost to SEO rankings. 3rd-party websites like Autotrader.com and Cars.com provide have some of the heaviest website traffic in the world. Links to your site tells search engines you are important too.
- Ensures these links from 3rd party websites are setup correctly. There’s nothing worse than finding out 6 months later someone forgot the ‘s’ at the end of the url and the link was sending shoppers to a 404 not found page. This will also de-value your SEO efforts.
- Helps you make an educated decision (rather than gut feeling) on what 3rd-party website is truly helping your digital marketing efforts.
Where to Find Referral Traffic in Reports
Directly access your referral traffic in Google Analytics (hint: that link will take you directly to the report).
If you like doing it the other way, login to Google Analytics and on left click Acquisition > All Referrals.
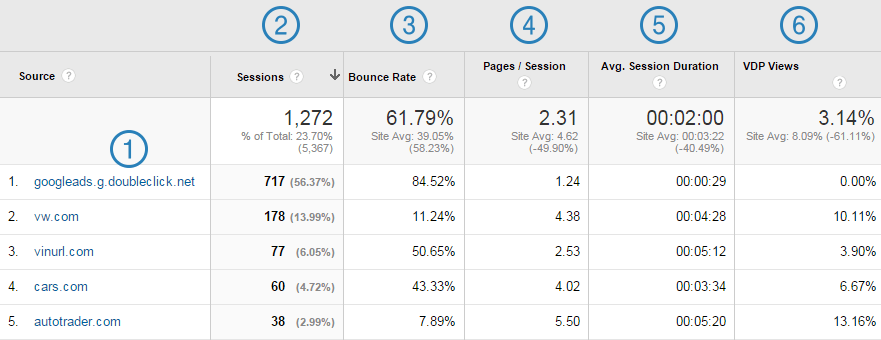
Your report should look something like this, minus the VDP view column. VDP setup is an article for a later date.

Q: Based on this report can you tell which referrer provides the most value?
Q: Which referrer provides the least value?
#1 Google SEM. You pay a lot of money for those visitors to click through to your website. An 84% bounce rate isn’t very effective.
#2 Tells us the Sessions or what Google previously called Visitors. Pretty self explanatory, vw.com brought the most organic visitors over.
#3 Bounce Rate. Assuming your analytics is setup to default, these are shoppers that left your site in 30secs or less. This could also be a strong indicator the shopper didn’t like your site or your website’s usability factor. Maybe because it was slow, not mobile-friendly or because they were attacked with Pop-up ads to “Save $500 – Ask For ISM Joe”. Grr…
Learn Why 55% of People Spend Less Than 15 Seconds On Websites
#4 Pages Per Session/Visit. So maybe the shoppers aren’t bouncing off your site but how many pages did they visit after you spent all that money to get ’em there?
#5 Avg Session Duration. How long did they stay on your site? Longer they stay = Lower in the shopping funnel = Good chance they could be stopping by Saturday to see you.
Are You Engaging Women Shoppers?
#6 (bonus) VDP Views. The Holy Grail of a Digital Marketing stats for dealerships. Hey, we don’t sell the cars so VDP’s is our value statement!
VDPs prove to be MVPs For Online Vehicle Sales
So which referring source provides the most value?
Autotrader.com provided the highest quality visitor, we just need more of them. Shh… Don’t tell your Autotrader rep.
The OEM site brought over the most and with reputable stats.
Google SEM is at the bottom with that bounce rate. Do we really need all that spend towards SEM? Your call.
Takeaway
- How to find the referral traffic report in Google Analytics.
- Understanding what the referral data means.
- How other factors like website usability can affect your website traffic.
- Understanding what referrers provide the highest value.
- Ideas on how to drive more traffic from those referrers.
If you’re looking to maximize your dealership inventory, website or analytics, contact me below!
